Video Summary
10 Key Points Listed.
Followed by Illustration of Each.
1. The Business Case. Originations: sum total of dollars of all mortgages sold by a company. Recover Decline in Originations by Improving Customer Experience (CX).
2. The Business Challenge. Identify the Options to Recover Decline from $4500M to $5000M. Decide on the option with best financial outcome.
3. Algorithm Connecting Dollars Gained to IT Dollars Invested. The $ value of 1% retention increase can then be compared to the $ value invested in improved CX software.
4. Quantifying Dollars Gained for IT Dollars Invested. IT Dollars Invested in Software to Improve Customer Experience (CX).
5. Deriving Mortgage Generation Expected for Option 3. Combined Retention, 49%. Origination, $5250M. on Date, 3/31/2023.
6. Deriving Mortgage Generation Expected for Option 2. Combined Retention, 49%. Origination, $5250M. on Date, 9/30/2023. Option 3 on Date is better, 6 months earlier.
7. Deriving Mortgage Generation Expected for Option x. Combined Retention, 47%. Origination, $5036M. on Date, 12/31/2022. Option x on Date is better than Options 3 and 2.
8. Deriving Mortgage Generation Expected for Option FCD. Combined Retention, 46%. Origination, $4929M. on Date, 9/30/2022. Option FCD Origination, $4929M < $5,000M Required
9. Decision: Option x Delivers Best Dollar Results. Beats gut feeling decision: flying half blind into financial outcome.
10. Decision: Option x Delivers Best Dollar Results
1. The Business Case
Originations: sum total of dollars of all mortgages sold by a company. Recover Decline in Originations by Improving Customer Experience (CX).
Recovering Mortgage Originations
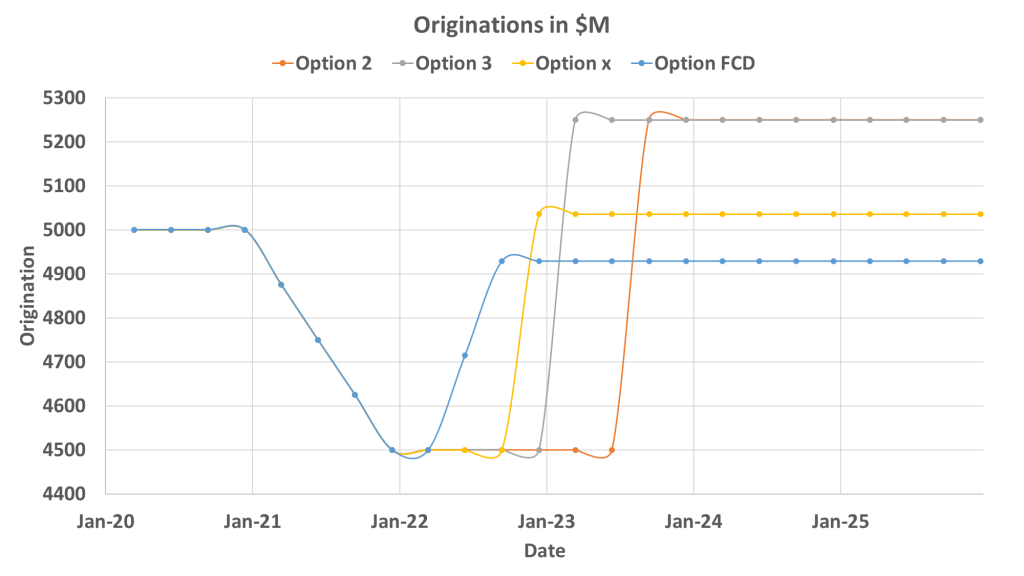
In the graph we see that originations of ACME company are 5,000 million dollars per quarter in the last quarter of 2020.
A year later, in the last quarter of 2021 the originations are $4,500M.
To recover the decline of originations ACME retained the services of PPWars company. A common occurrence in mortgage servicing business is to sell an underperforming company. To avoid losing their jobs, recovering originations ASAP was important for ACME executives. PPWars algorithms incorporating technology, finance and sales considerations was appealing because it will bring a few recovery options from which to choose from. From those options executives planned to carefully choose the one that offers low risk on one hand and good business results on the other hand. In addition, PPWars approach is economical, minimizing the occurrence of unnecessary rework.
Working with ACME IT and ACME finance, PPWars suggested 4 options to recover originations shown in the graph. ACME requested additional information before picking an option. Using this additional information, ACME picked Option x and implemented it. The graph summarizes the business problem (fall in $ origination) and the solution (recovery in $ origination).
We now describe the activities that resulted in this summary graph.
2. The Business Challenge
Identify the Options to Recover Decline from $4500M to $5000M.
Decide on the option with best financial outcome.
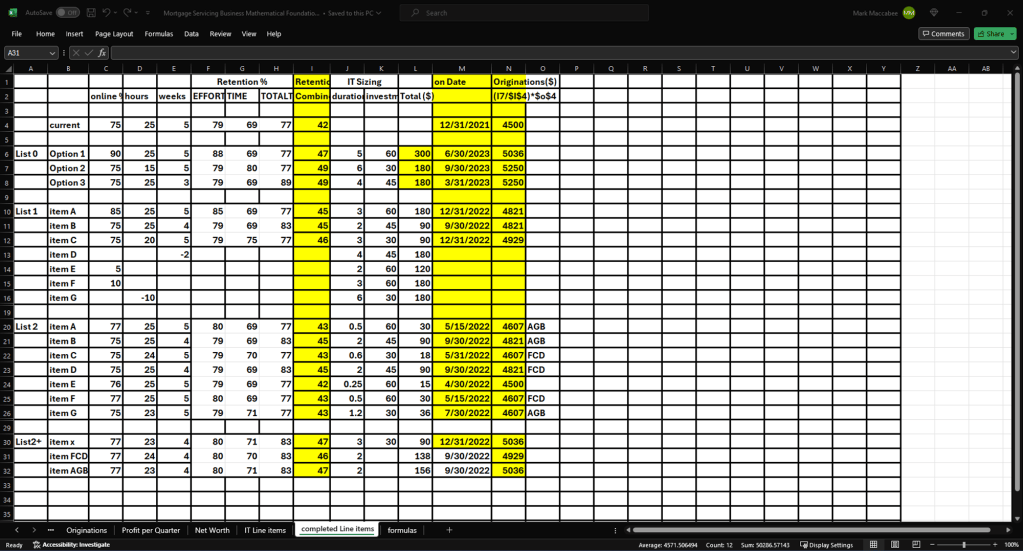
Mortgage applications are very tedious, and a significant percentage of applicants just drop out before completing. Customer Experience (CX) is challenging. Improving CX brings higher retention (resulting in proportional higher origination). PPWars determined retention in the fourth quarter of 2021 to be 42%. 42% of applicants actually submit. To bring originations up from $4500M to $5000M requires retention to go by same proportion: (5000 divided 4500), 1.11. Increasing 42% by 1.11 is 47%. PPWars asked ACME IT for ideas to improve ACME software to increase retention from 42% to 47%. ACME IT came back with a list of ideas (line items) enumerated in column B of line items table. The 6 columns following column B contain details of deriving the actual (combined) retention in the subsequent column, Retention Combined. Content of those 7 columns (6+1) will be described below. Next are columns that contain values of IT sizing: duration in quarters, $ per quarter, total $. ACME IT provided “IT Sizing” after software, hardware, etc. design of each line item (no development was done). The delivery date for each line item is listed in column “on Date”. The last column lists $ origination in millions (proportional to combined retention column value). PPWars analyzed those line items and picked 4 of them as options to increase retention and thus to recover the originations. Those line items are in the table. Rows 7, 8, 30, 31 are those 4 options. PPWars drew 4 lines on the graph following last Quarter of 21 for those 4 options.
3. Algorithm Connecting Dollars Gained to IT Dollars Invested
The $ value of 1% retention increase can then be compared to the $ value invested in improved CX software.
Those 4 lines show that originations remained at $4,500M for a few quarters until software development was completed. Then those 4 lines went up, to around $5,000M level, and stood at this level, showing the effect of increased retention. Except for OptionFCD all options had recovered the originations and went up even beyond $5,000 million.
Let us show how retention value determines business success (mortgage generation). Using IT systems, we can determine the number of mortgage applications that started in a given business day. If on 6/1/2022 100 applications were started, we can determine the number of those submitted in the weeks following. This number, for example 42, will be the retention for the day June 1. If improved CX software is introduced on 6/2/2022, we can similarly get retention for this day. If June 2 retention is 43%, we know that improved CX software increased retention by 1%. The $ value of 1% retention increase can then be compared to the $ value invested in improved CX software. Full digitization of business (using numbers to document everything) produced massive data on the relation between CX improvements and retention. Our algorithms use this data to establish retention increase for any improved CX feature.
4. Quantifying Dollars Gained for IT Dollars Invested.
IT Dollars Invested in Software to Improve Customer Experience (CX).
There are 3 variables to improve CX quality, which in turn increase retention. The first variable is online %: percentage of the mortgage process that is online. If application process has 100 steps and 75 are online (rather than printouts, FAXes), online % =75%. A higher online % value improves retention. The second variable is hours: is the sum of all the time it takes to handle the application, for example, hours=25 hours.
The higher value of hours reduces retention. The third variable is weeks: is total calendar time. The number of weeks from starting a mortgage application until the applicant actually submits it. For example, 5 weeks.
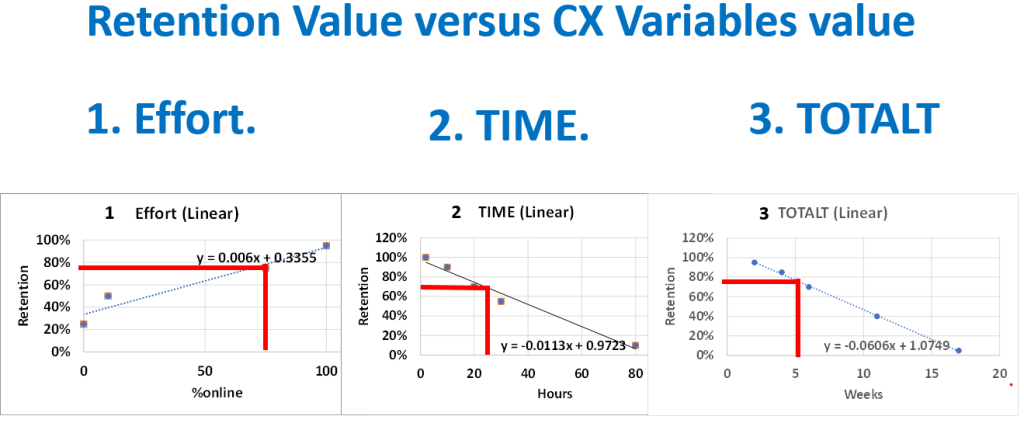
The higher value of weeks reduces retention. The question is how these 3 variables affect retention. Suppose online % is 100%. There is no way to improve online %. We call retention achieved through improving online %, Effort. In this case Effort is 100%. What is retention (Effort) for online % = 75%? Or for any other online % value? We mentioned before that digitization of business produced massive data on the relation between CX improvements and retention. We use these data to produce a graph showing Effort versus online %. Similarly, we produce a graph showing TIME versus hours. Also, a graph showing TOTALT versus weeks.
5. Deriving Mortgage Generation Expected for Option 3
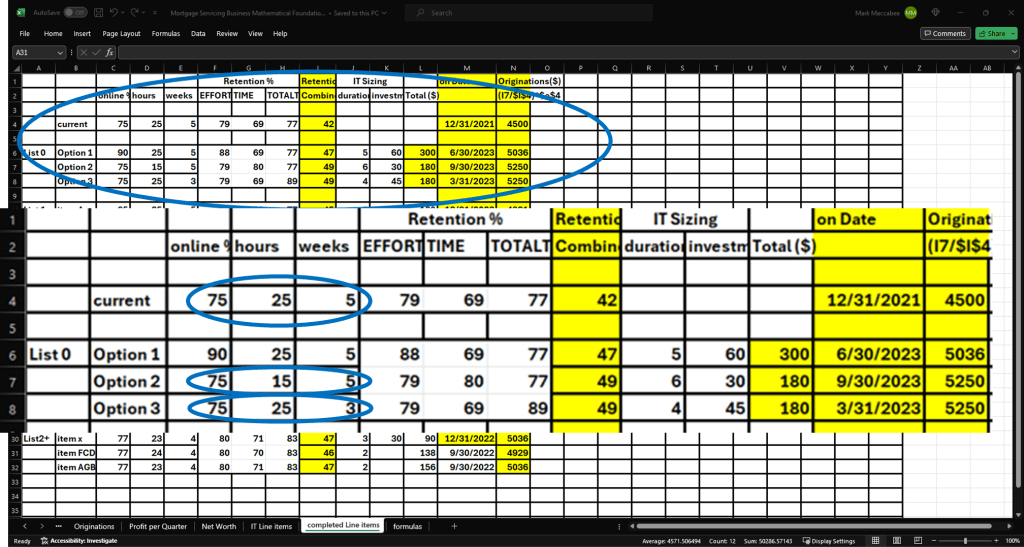
Combined Retention, 49%. Origination, $5250M. on Date, 3/31/2023
Using these graphs, we derive from each of the above 3 CX variable values, 75, 25, 5, the corresponding retention values: 79%, 69%, 77%.
Let us place those values in the appropriate columns in row 4 in the table.
The combined retention column value is the product of these 3 retention values, 42% (79% multiply by 69% multiply by 77%). In column on Date, the value is 12/31/2021: fourth quarter 21. PPWars team joined ACME on this point in the graph: fourth quarter 21, $4,500M. Unless retention is increased, $4,500 will continue for future. One of the line items proposed by ACME IT in the table is row 8, Option 3. Line “Option 3” in the graph is based on this row 8 in the table. Row 8 states that CX variables of row 4: 75, 25, 5 will change to: 75, 25, 3 after implementing Option 3 project.
CX variable weeks goes down from 5 to 3 weeks. ACME IT states that improved software reduces CX weeks by 2 weeks. This will increase TOTALT retention from 77% to 89%. Combined retention will go from 42% to 49% bringing originations higher by the ratio of 49 divided by 42, to $5,250M. The cost of Option 3 project is $45M per quarter, for 4 quarters. Total $180M.
6. Deriving Mortgage Generation Expected for Option 2
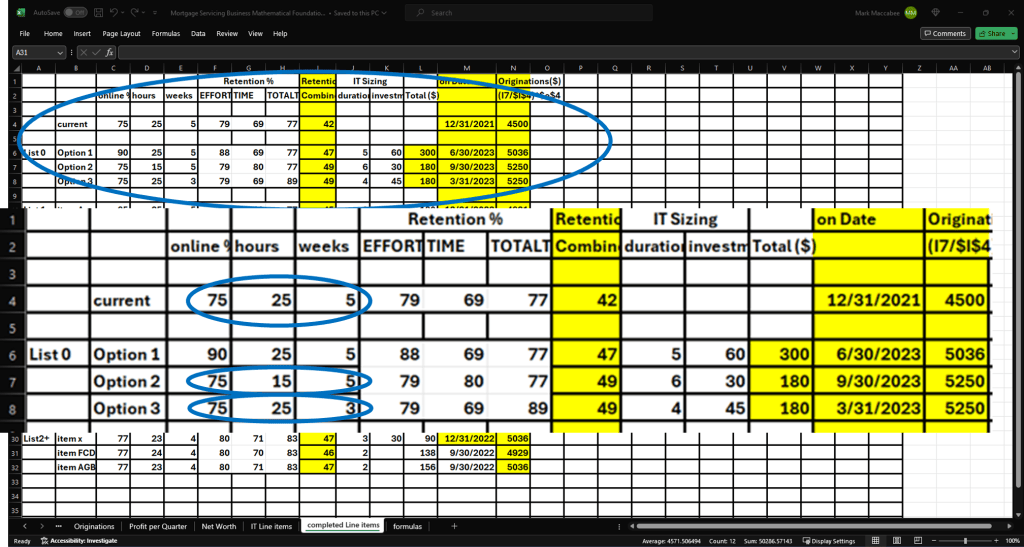
Combined Retention, 49%. Origination, $5250M. on Date, 9/30/2023. Option 3 on Date is better, 6 months earlier.
Another line item is row 7, Option 2. Line “Option 2” in the graph is based on this row. Row 7 states that CX variables of row 4 change to: 75, 15, 5 after implementation an OPtion 2. CX variable hours will go down from 25 to 15 hours. ACME IT stated improved software will reduce TIME by 10 hours. This will increase TIME retention value from 69% to 80%.
Combined retention will go from 42% to 49% bringing originations higher by the ratio of 49 divided by 42, to $5,250M. The cost of Option 2 project is $30M per quarter for 6 quarters. Total $180M.
7. Deriving Mortgage Generation Expected for Option x
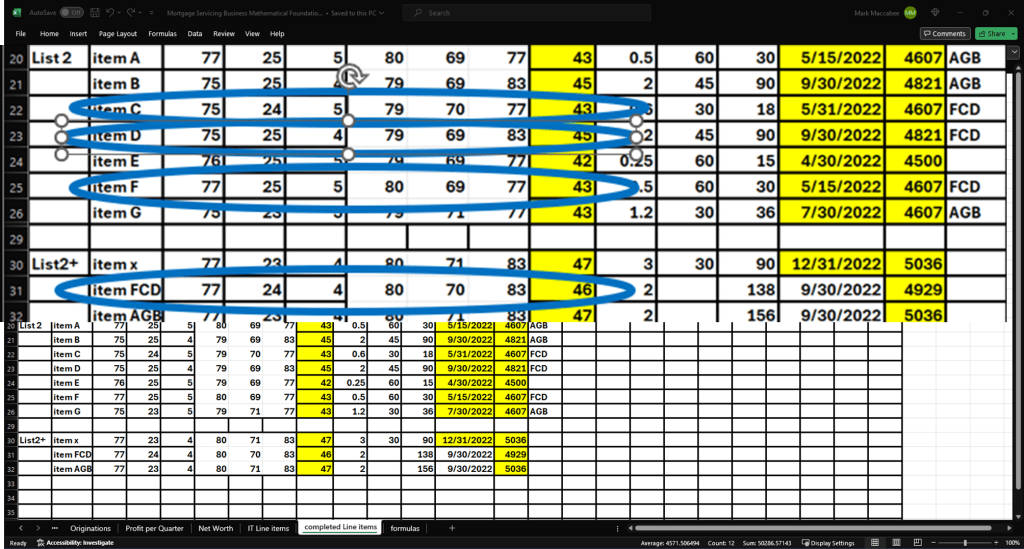
Combined Retention, 47%. Origination, $5036M. on Date, 12/31/2022. Option x on Date is better than Options 3 and 2.
Option x in the graph is based on row 30 in the table. Row 30 states that values of CX variables in row 4 change to: 77, 23, 4 after implementing Option x project. All 3 CX variables improve retention. Combined retention will go from 42% to 47% bringing originations higher by the ratio of 47 divided by 42, to $5036M. The cost of item x project is $30M per quarter for 3 quarters. Total $90M.
8. Deriving Mortgage Generation Expected for Option FCD
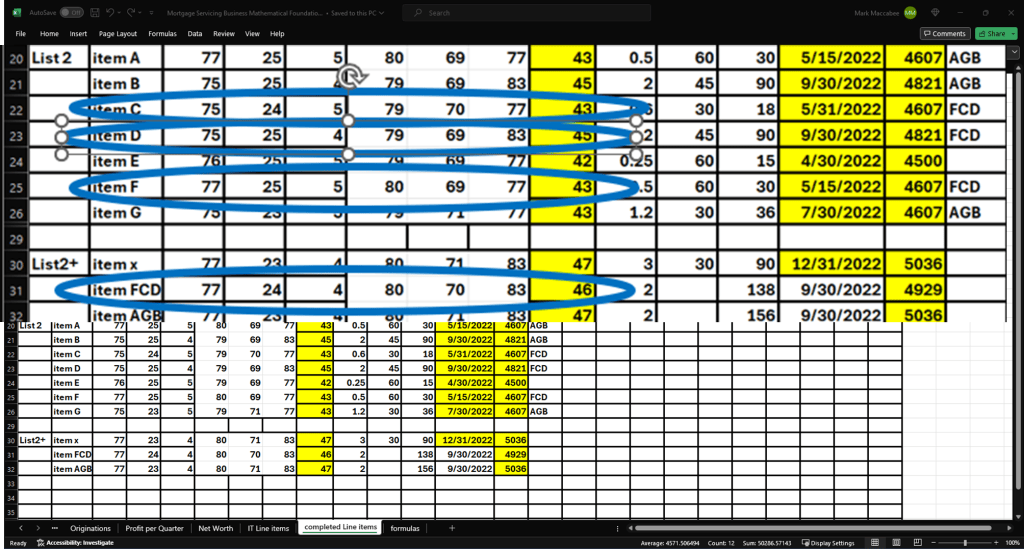
Combined Retention, 46%. Origination, $4929M. on Date, 9/30/2022. Option FCD Origination, $4929M < $5,000M Required
The line items in rows 25, 22, 23, items F, C, D, each do not raise combined retention to required value of 47%. However, combining those 3 in one IT project, “Option FCD” on line 31 looks promising. Row 31 states that values of CX variables in row 4 change to: 77, 24, 4 after implementing project Option FCD. Combined retention will go from 42% to 46%, bringing originations higher by the ratio of 46 divided by 42, to $4929M. The total cost of Option FCD project is $138M and takes 2 quarters.
10. Decision: Option x Delivers Best Dollar Results
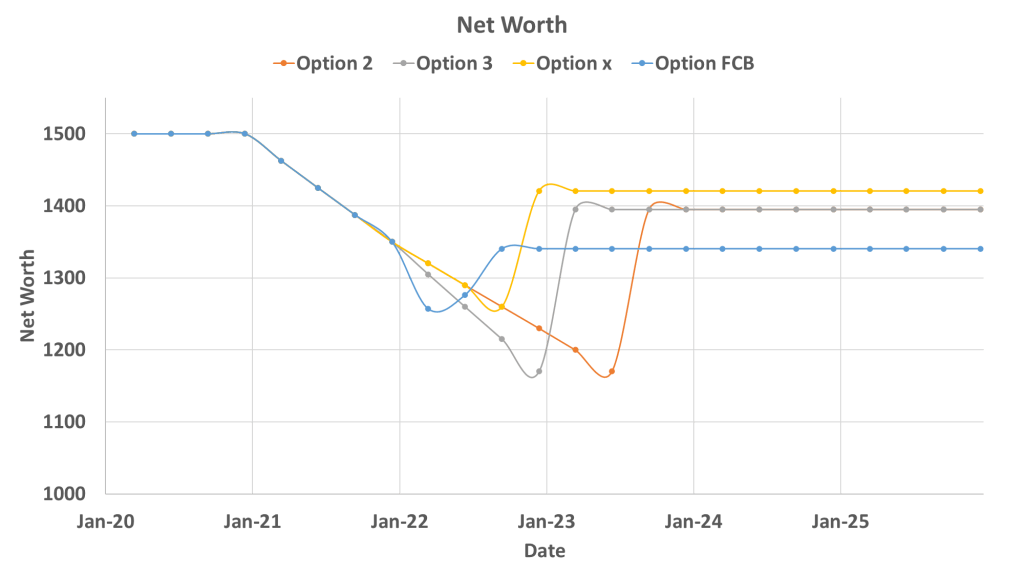
Will reach $5,000M earliest and will have highest Net Worth.
Beats gut feeling decision. Flying half blind into financial outcome.
Although it is ACME’s decision to make, which of the 4 projects is best, PPWars suggested Option x. Option x reaches $5,000M originations level in fourth quarter 2022, before Option 3 or Option 2 reach $5,000M.
Also, Option x may require less investment than Options 3 or 2. To confirm this decision, PPWars prepared for ACME, the Net Worth graph.
Net Worth graph shows that OPtion x has the highest resulting Net Worth.