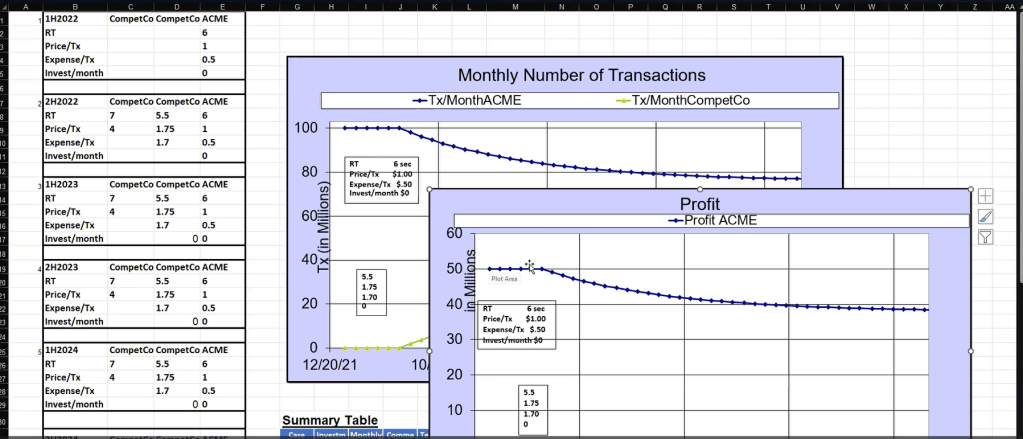
The image shows market share and profit of two companies, ACME and CompetCo. It is drawn by PPWars software to forecast market share of metal trading exchange.
The video below explains the dynamic changes over the period of 2022 through 2025.
1. The Passive Case.
the case where ACME “does nothing to counter the competition”,
This graph shows market share of two companies, ACME and CompetCo over a period of 2022 through 2025. The graph is drawn by PPWars software to forecast market share of metal trading exchange. It shows that ACME had 100% of the market until July of 2022, at which point a different company, CompeteCo enters the marketplace. PPWars software uses the table on the left as input and the graphs on the right as output. ACME has a transaction response time of six seconds and the price of dollar. When CompetCo comes into the marketplace it has response time of 5.5 seconds and $1.75 price per transaction. These graphs forecast market place changes once CompetCo enters the market. The graphs describe the case where ACME “does nothing to counter the competition”, The Passive Case. ACME share of Market declines from 100 million transactions per month to 76 million. PPWars software draws a graph showing profit of ACME over the period. ACME makes a profit of 50 million per month. This profit declines to 38 million per month. Let us record the results of Passive case in Summary Table.
2. Match Case.
ACME offering to match Response Time and Price of CompetCo.
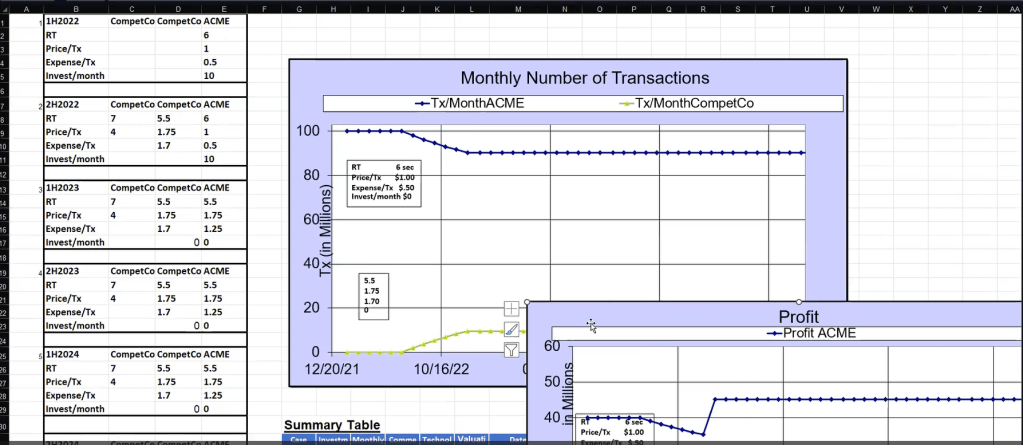
In addition to this Passive Case, another set of graphs is now drawn by PPWars software for the Match Case. ACME IT suggested a project to upgrade ACME offering to match Response Time and Price of CompetCo. The project will take 12 months at a cost of $10 million per month. Let us update the input table with this information. $10 million per month for first six months and $10 million per month for the next six months and then no more. At the beginning of 2023 ACME response time is going to be 5.5 seconds and the price is going to be $1.75. Consequently PPWars produces the following market share graph. ACME market share declines from 100 million and then stabilizes at 90 million. The profit goes from 50 million $ per month to stabilize at $ 45 million per month. Let us record the Match Case results in Summary Table.
3. Summary Table
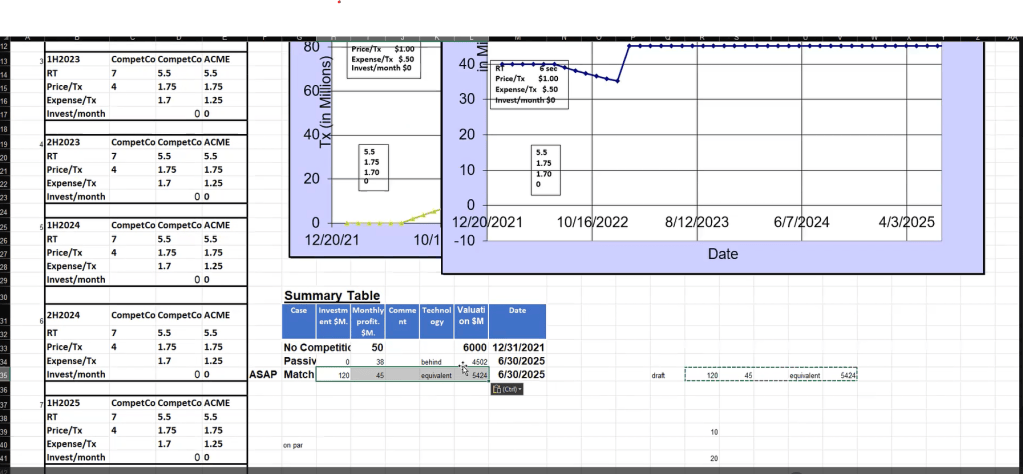
Match case delivered higher eventual profit ($45 versus $38) despite $120M investment.
Moreover, Match case places ACME in the same technology generation as CompeteCo. In Passive case ACME would be one technology generation behind.
Summary Table indicates which case is the better choice. Match case delivered higher eventual profit ($45 versus $38) despite $120M investment. Moreover, Match case places ACME in the same technology generation as CompeteCo. In Passive case ACME would be one technology generation behind. PPWars software requires input from Finance, IT and Sales. It ties together these three interconnected perspectives. This is because PPWars uses market data to create a model and algorithms. PPWars addresses market (see Gartner and others) long standing opinion that Finance and IT do not communicate. Quote: “It cost 1% of revenue per decision with current products. Dramatic business impact over time”.
Moreover, Match case places ACME in the same technology generation as CompeteCo. In Passive case ACME would be one technology generation behind.
 ppwars.com